
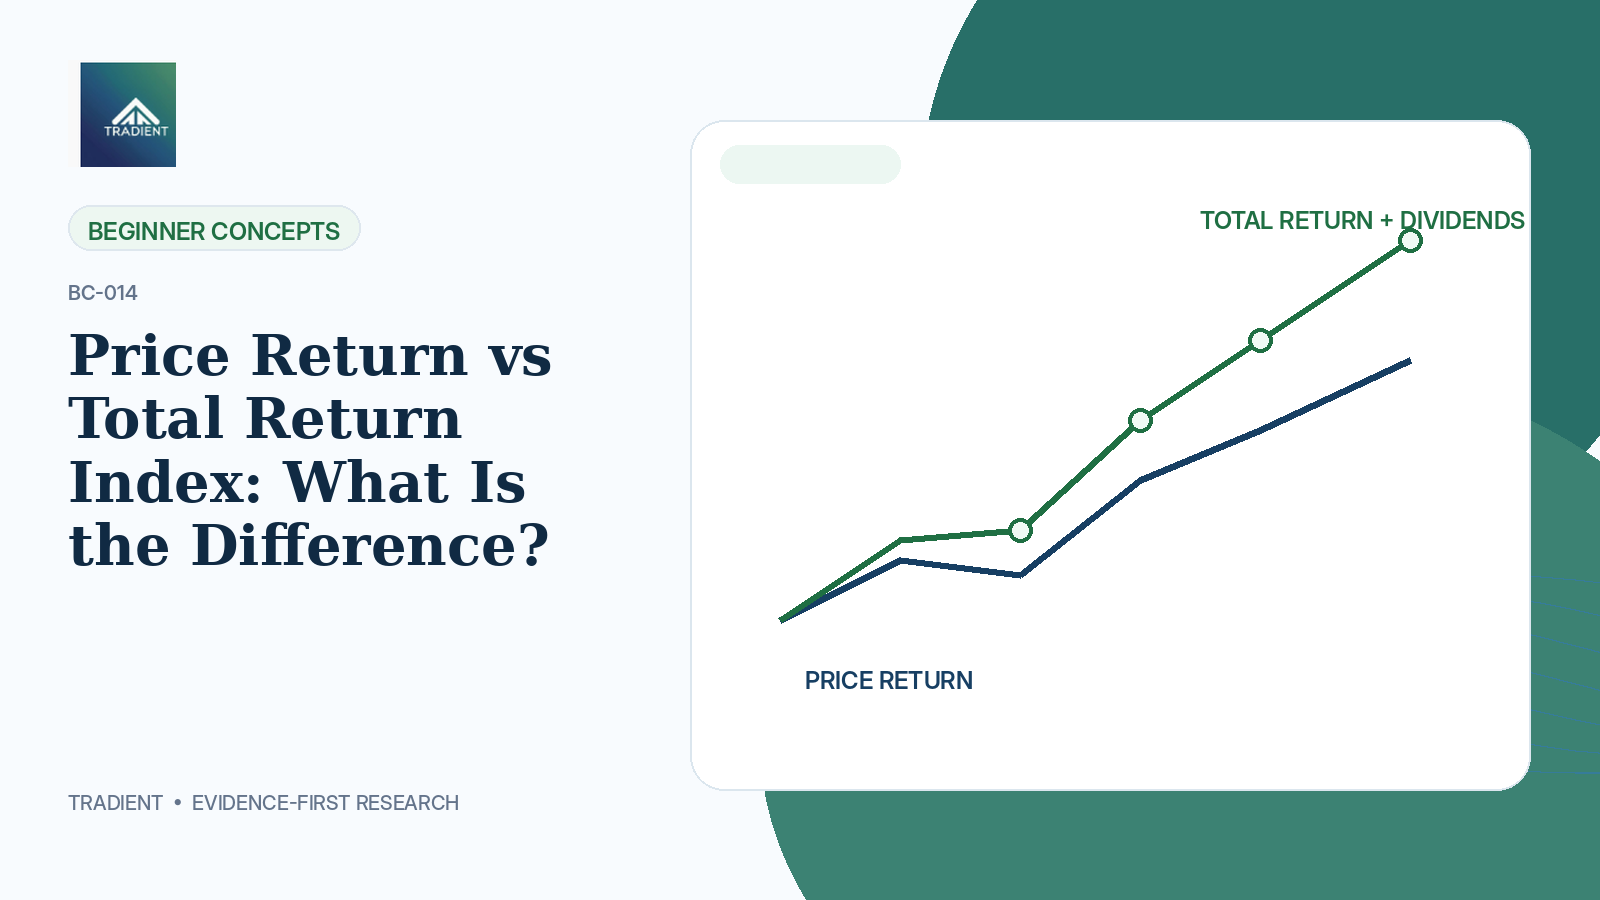
At a glance: A price return index measures gains and losses from constituent prices. A total return index measures price change plus distributions such as dividends under the index methodology, typically assuming reinvestment. Over long periods, that difference can materially affect the benchmark outcome.
Two charts can carry the same index name and still show different long-term returns. The reason is often the difference between the price-return version of an index and its total-return version.
For beginners, this is more than an index technicality. Choosing the wrong benchmark can make a portfolio or fund look better or worse simply because one side of the comparison includes dividends and the other does not.
What a price return index measures
A price return index reflects changes in the market prices of its constituents according to the index weights. If share prices rise, the index rises; if they fall, the index falls. Cash dividends paid by the companies are not treated as reinvested return in the price index.
Headline versions of famous indices are often quoted as price indices, which is why the daily number discussed on television may not represent the full economic return available to a shareholder.
What a total return index adds
A total return index begins with the same constituent price movements but also incorporates distributions in accordance with the methodology, commonly by assuming that cash dividends are reinvested into the index.
This creates a compounding effect. A reinvested dividend can itself participate in subsequent market gains or losses, so the gap between price return and total return can widen over long holding periods.
A simple numerical example
Imagine a one-stock index begins at 100. The share price rises to 106 over the year and the company pays a dividend equal to 3% of the starting value. Ignoring technical timing, the price return is roughly 6%, while the economic return including the dividend is roughly 9% before considering the reinvestment timing.
Real index calculations are more precise and follow methodology-specific adjustments, but the example captures the key idea: dividends are part of shareholder return even though they are not part of a pure price index.
Why benchmark choice matters for funds
An equity mutual fund owns shares and may receive dividends from portfolio companies. Comparing that fund only with a price index can create an uneven comparison because the fund’s returns economically include distributions received by the portfolio.
A total return benchmark is therefore generally more appropriate when evaluating long-horizon investment performance, subject to the fund’s stated benchmark and the regulator’s disclosure framework.
Total return does not mean guaranteed return
The phrase ‘total return’ can sound like a promise, but it is simply a calculation convention. A total return index can fall sharply when prices decline. Dividends may cushion the result, but they do not remove equity risk.
Companies can also reduce or omit dividends. The index incorporates distributions that actually occur under its methodology; it does not assume a fixed dividend yield forever.
Use like-for-like comparisons
When comparing an index fund, an active fund or your own portfolio with a benchmark, first check whether the benchmark series is price return or total return. Then check the same currency, time period and treatment of fees and taxes.
A clean comparison does not guarantee a correct investment decision, but it prevents a basic measurement error from distorting the conclusion.
How to use this concept when reading the market
Treat price return vs total return index: what is the difference? as a framework rather than a prediction. When you see the concept mentioned in a market headline, identify the exact variable being measured, the relevant time period and the institution or methodology behind the number.
Then connect it to the decision you are actually making. A benchmark concept may help you compare performance; a market-structure concept may explain how an order is processed; a valuation concept may help you interpret a ratio. The concept is useful only when it improves the quality of a specific question.
- Price return measures constituent price changes; total return also includes distributions under the methodology.
- Dividends can create a meaningful long-run gap between price and total-return series.
- Check the current official methodology or rule when the definition can change.
- Separate what the measure tells you from what it does not tell you.
Common beginner mistakes to avoid
A common mistake is converting a descriptive market concept into a buy-or-sell signal. Indices, liquidity measures, exchange rules and return calculations describe part of the system; they do not by themselves establish expected return.
Another mistake is memorising a current constituent count, lot size, weight or operational rule and treating it as permanent. Market infrastructure and index methodologies are maintained over time. Build the habit of checking the latest primary source when precision matters.
A five-minute verification routine
- Identify the official source: SEBI, NSE, BSE/NSE Indices, depository or issuer as relevant.
- Confirm the date of the factsheet, circular or methodology.
- Check whether the figure is price return, total return, free-float weighted or another defined measure.
- Write one sentence describing what the number does not prove.
- Only then connect the concept to a portfolio, trading or research decision.
Key takeaways
- Price return measures constituent price changes; total return also includes distributions under the methodology.
- Dividends can create a meaningful long-run gap between price and total-return series.
- Total return is often the fairer benchmark for long-horizon equity performance comparisons.
- A total return index can still lose money when markets fall.
- Benchmark comparisons should be like-for-like in return type, period and currency.
- Always check the official index methodology rather than inferring return treatment from the headline name.
Frequently asked questions
Is Nifty 50 TRI different from Nifty 50?
Yes. The TRI is the total-return version and includes distributions under the methodology, while the headline price index reflects price movements.
Do total-return indices include taxes and fund expenses?
An index methodology specifies its own treatment. An investable fund will additionally have real-world expenses and taxes that can create tracking differences.
Why is the TRI usually above the price index over long periods?
Because reinvested dividends add to cumulative return when distributions are positive. The exact gap varies through time.
Should every fund beat the price index?
That is not a sound standard. Use the fund’s appropriate stated benchmark, preferably a total-return version where required or relevant, and evaluate risk and consistency as well as return.
This article is for educational purposes only and is not investment advice or a recommendation to buy or sell any security.
Sources and further reading