
AT A GLANCE BEGINNER’S CONCEPTS
Volatility describes how much prices move; investment risk asks what could prevent you from reaching a financial goal. A calm price chart can conceal poor liquidity, weak finances or concentration, while a turbulent market does not automatically imply permanent loss. Assess the downside, the time available to recover and the circumstances that might force a sale.
Last reviewed: 21 October 2026
Imagine two investments. One rises and falls visibly each week. The other hardly moves for months—until buyers disappear just when you need to sell. Which is riskier? Price fluctuations are easy to measure, but they do not tell you everything that can go wrong. Separating volatility from risk helps beginners ask better questions before committing money.
Risk depends on the investor as well as the investment: someone saving for next month faces a different danger from someone saving for retirement decades away. This is why a single volatility score cannot replace a clear goal, a realistic time horizon and an assessment of possible losses.
Volatility measures movement; risk concerns outcomes
Volatility is the variation in an asset’s price or returns over time. Standard deviation is one common measure: larger swings typically produce a higher reading. Investment risk includes the possibility of losing capital, failing to fund a goal, losing purchasing power or being unable to sell at a reasonable price when money is needed.
A diversified equity fund may have volatile daily prices yet remain useful for a long-term objective; that does not make it safe or guarantee recovery. Conversely, a thinly traded share may appear stable because few trades occur, even though a future exit could be difficult. The measurement and the decision must be kept separate.
Five risks a quiet chart may hide
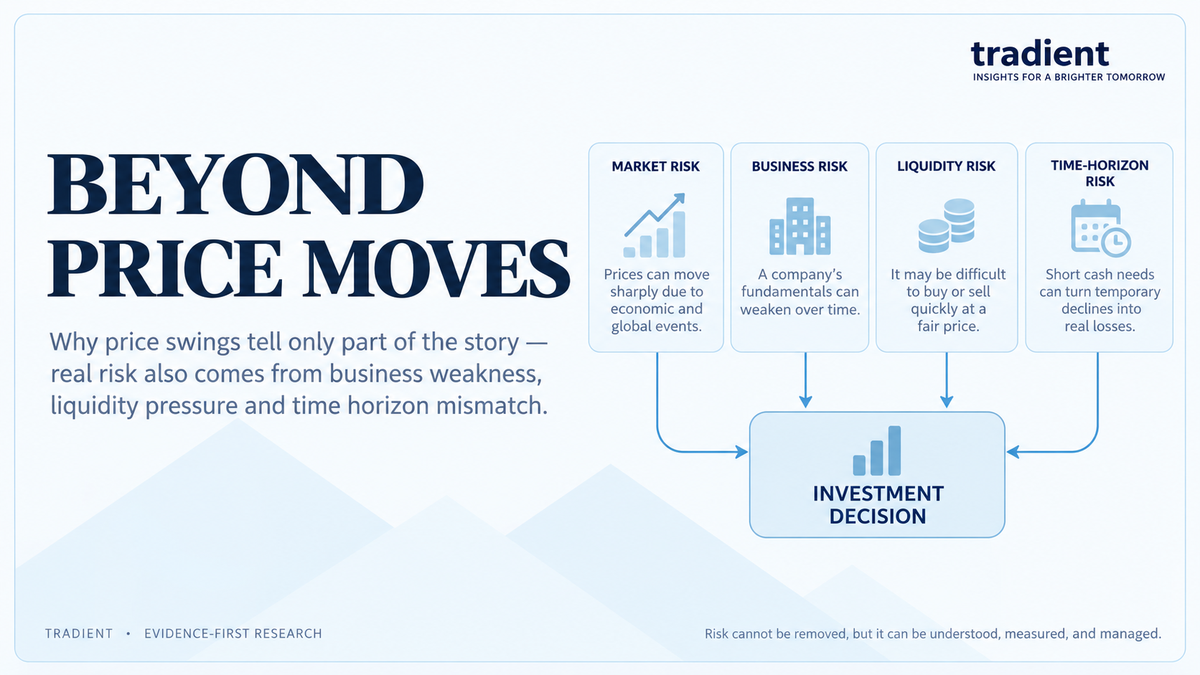
Market risk affects many securities at once. Business or credit risk arises when earnings, cash flow or debt repayment weaken. Liquidity risk means selling promptly may require a steep discount. Concentration risk results from depending heavily on one company, industry or idea. Inflation risk reduces what future money can buy. These distinctions are also described in SEBI’s investor-education material.
Each danger calls for different evidence. Look at financial statements for business resilience, trading activity and spreads for liquidity, portfolio weights for concentration, and spending needs for time-horizon risk. A price chart is one input to this assessment, not the complete answer.
Five indicators to watch—and their limits
The table converts measurements into practical questions. No measure works in isolation, and historical observations cannot guarantee a future result.
| What to watch | Question to ask |
|---|---|
| Standard deviation and range of returns | How wide are ordinary return fluctuations, and were extreme observations excluded? |
| Maximum drawdown | What was the largest observed peak-to-trough loss, and over what period? |
| Liquidity and bid-ask spread | How much could trading costs and poor liquidity worsen a forced exit? |
| Debt and balance-sheet resilience | Could debt maturities or weak cash generation cause impairment despite low price volatility? |
| Time horizon and goal funding | Does the investor need the capital before an adverse market period might recover? |
A worked example: loss, recovery and timing
Consider an illustrative investment worth ₹1,00,000 that falls 30% to ₹70,000. Recovering its starting value then requires a gain of approximately 42.9%, not 30%: ₹30,000 divided by ₹70,000. This arithmetic explains why drawdown matters even when a decline is described as temporary. It says nothing about whether recovery will occur.
Now compare two people holding the same asset. One must pay a fee in three months and may be forced to sell while prices are depressed. The other has a much longer horizon, enough emergency liquidity and the ability to tolerate losses—but still faces business and market risk. The price path is identical; the consequences are not.
How to assess risk before investing
Begin with the goal: when will you need the money, how much shortfall could you withstand, and what other resources are available? Then ask how the investment could fail. Check whether returns depend on leverage, a single borrower, one market theme or optimistic cash-flow assumptions. Review whether diversification genuinely spans different exposures rather than many names driven by the same factor.
Finally, write a decision rule before emotions take over: what evidence would invalidate the thesis, what would trigger a review, and how would you fund an unexpected expense without a forced sale? Diversification and matching assets to time horizon can reduce some risks, but cannot eliminate market-wide losses or assure a positive outcome.
Common mistakes to avoid
- Calling low volatility “safe”. Infrequent trades and smoothed valuations can disguise uncertainty.
- Calling every price fall permanent. First investigate fundamentals, cash needs and realistic recovery possibilities.
- Ignoring position size. A tolerable fluctuation becomes consequential when too much capital depends on one outcome.
- Using historical metrics as forecasts. Drawdowns and standard deviations describe observed periods, not future limits.
Key takeaways
- Volatility measures movement; risk concerns what those movements or other events could cost you.
- Low observed volatility can coexist with liquidity, credit or concentration risk.
- A 30% loss needs about a 42.9% gain to recover the starting amount.
- Time horizon and emergency liquidity affect the consequences of a drawdown.
- Combine return variability with drawdowns, fundamentals and exit conditions.
- Diversification helps manage some risks but cannot remove all losses.
Frequently asked questions
Does higher volatility always mean greater risk?
No. Higher volatility signals wider observed price changes and can make short-term outcomes harder to manage. But a low-volatility investment may still suffer permanent impairment, illiquidity or loss of purchasing power. Compare the measure with the underlying risks and your funding needs.
Is a price decline the same as permanent capital loss?
Not necessarily. A quoted decline becomes a realised sale loss if you sell below cost; permanent economic impairment may arise when an asset’s future cash flows or business value deteriorate. Recovery is never guaranteed, so examine the reasons for the decline rather than assuming either outcome.
Why do time horizon and liquidity matter?
If money is needed soon, an otherwise recoverable fall can force a sale at an unfavorable price. Liquid reserves and a realistic investment horizon reduce the chance of having to sell under pressure, although they do not prevent the underlying asset from losing value.
Which risk measure should a beginner start with?
Start with a simple combination: the largest plausible loss you can tolerate, historical maximum drawdown, when you may need the money and whether the investment can be sold readily. Add business quality, diversification and inflation exposure; avoid relying on one impressive-looking statistic.
EDITORIAL DISCLAIMER
This article is for educational purposes only and is not investment advice or a recommendation to buy or sell any security.