

When Crude Speaks, Markets Listen
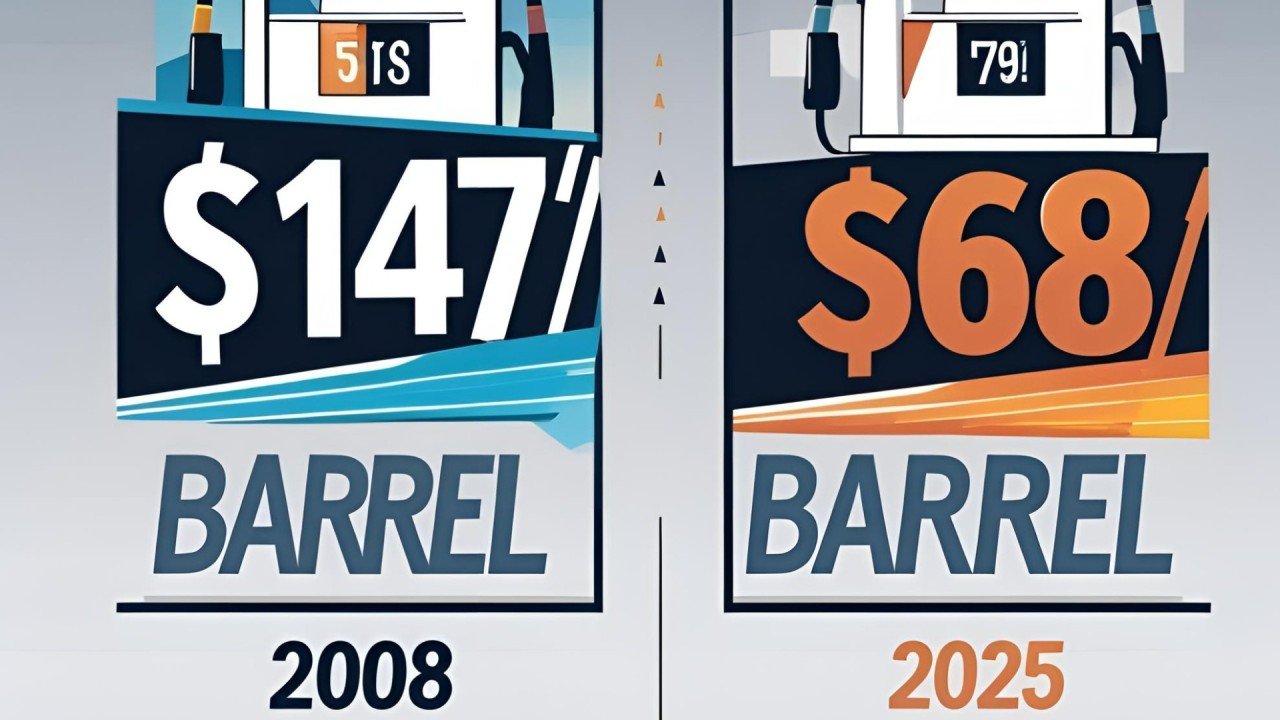
In 2008, crude oil hit an all-time high of $147/barrel.
Global equities plunged.
Inflation soared.
Currencies realigned.
Interest rates reacted.
Fast forward to 2025. Crude is trading near $68/barrel, and investors are wondering-
“Is this the calm before the commodity storm — or just another cycle?”
The answer lies in a discipline few retail investors fully use, Intermarket Analysis.
Know the Subject
Intermarket analysis studies the relationships between multiple asset classes — commodities, equities, interest rates, and currencies — to detect shifts in market direction and macroeconomic health.
Crude oil, being the lifeblood of the global economy, plays a central role in this.
When crude moves, it’s not just a commodity story — it’s a macro narrative unfolding.
Crude Oil Prices Going Up
Equities (Oil Importers) – Margins compress in sectors like airlines, logistics, and FMCG. Indexes like Nifty and Nikkei often suffer.
Equities (Oil Exporters) – Markets like Saudi Arabia, Russia, and Canada benefit as revenues surge.
Bond Yields – Rise due to inflation expectations → Central banks may hike rates.
Inflation – Direct impact via cost-push inflation (transport, manufacturing, etc.).
USD & INR (FX) – USD often strengthens as oil is dollar-priced. INR weakens as India is a major importer.
Gold – Sometimes rises as a hedge against inflationary pressures triggered by an oil spike.
Crude Oil Prices Going Down
Equities (Importers) – Sectors like auto, paint, and aviation see margin expansion and rally.
Bond Yields – Drop as inflation cools; central banks may maintain or ease policy stance.
Inflation – Moderates. A key driver for softening CPI/WPI in economies like India.
FX – Importer currencies (like INR, JPY) strengthen. Exporter currencies may weaken.
Insights from the Past
2008 Global Financial Crisis
- Crude surged to $147 → triggered inflationary panic.
- Equities fell sharply.
- Interest rates followed a rising → then emergency falling pattern.
2014–2016 Oil Crash
- Crude plummeted from ~$100 to ~$28.
- Equities in oil-heavy economies (Russia, Canada) underperformed.
- India benefited: Inflation dropped, RBI cut rates, equity rally ensued in the consumption sectors.
2020 COVID Shock
- Crude futures went negative in April 2020.
- Equities crashed temporarily but rebounded fast due to liquidity.
- Inflation bottomed out → later surged with stimulus-led demand.
2022–23 Russia–Ukraine War
- Brent crossed $120 briefly.
- Equities corrected, bonds sold off.
- Inflation soared across Europe and India.
- RBI and Fed both pivoted into rate-hiking cycles.
“If you don’t watch the interconnections between markets, you’re trading blind.”— John J. Murphy
What $68 Crude Implies Today?

Crude at $68 reflects:
- Moderate global demand (China sluggishness, OPEC balancing).
- Controlled supply (US shale not aggressively expanding).
- Inflation tamed but not dead (rates plateaued, not cut aggressively yet).
From an intermarket lens:
- Equities: Watch for outperformance in consumption-heavy sectors (autos, paints, logistics).
- Bonds: Yields could remain steady; expect central banks to “wait and watch.”
- Currencies: INR may stay stable if crude stays in the $60–75 range.

Takeaway
Crude oil is not just a number — it’s a cross-asset signal.
Whether you’re trading Nifty, investing in bonds, or holding gold, understanding the ripple effects of crude oil gives you an unfair edge in macro-informed investing.
References
- Murphy, J. J. (2004). Intermarket Analysis: Profiting from Global Market Relationships. Wiley.
- Bloomberg Markets. (2023). Crude Oil Futures Historical Data.
- Federal Reserve. (2022). Oil Price and Inflation Connection.
- Reserve Bank of India. (2023). Monetary Policy Reports.